I have a few hundred devices in my smart home, and at this scale I’ve realized that I’m effectively on call for the house 24×7.
SharpTools is my main day-to-day interface for the house. It gives me a single view of security, doors and garages, cameras, fire/CO/smoke detectors, leaks, lights, HVAC, batteries and the other things I care about.
What I was missing was observability of the infrastructure behind that dashboard.
So I built a monitoring layer using Grafana Cloud. Grafana Alloy runs on my NVR server and collects most of the logs and telemetry for things like Blue Iris, Docker, cameras, Alexa/Echo services and the server itself. I also wrote a Hubitat app that sends a heartbeat plus CPU, memory, temperature and database health information directly to Grafana.
Grafana then watches all of this and has alert rules for things like the NVR or Docker going down, Blue Iris becoming unavailable, cameras disappearing, Hubitat missing its heartbeat, Echo Speaks failing, excessive errors, and multiple services failing together.
The part that might be particularly interesting to this community is what happens next: I send those alerts back through Hubitat and surface them on my SharpTools dashboard.
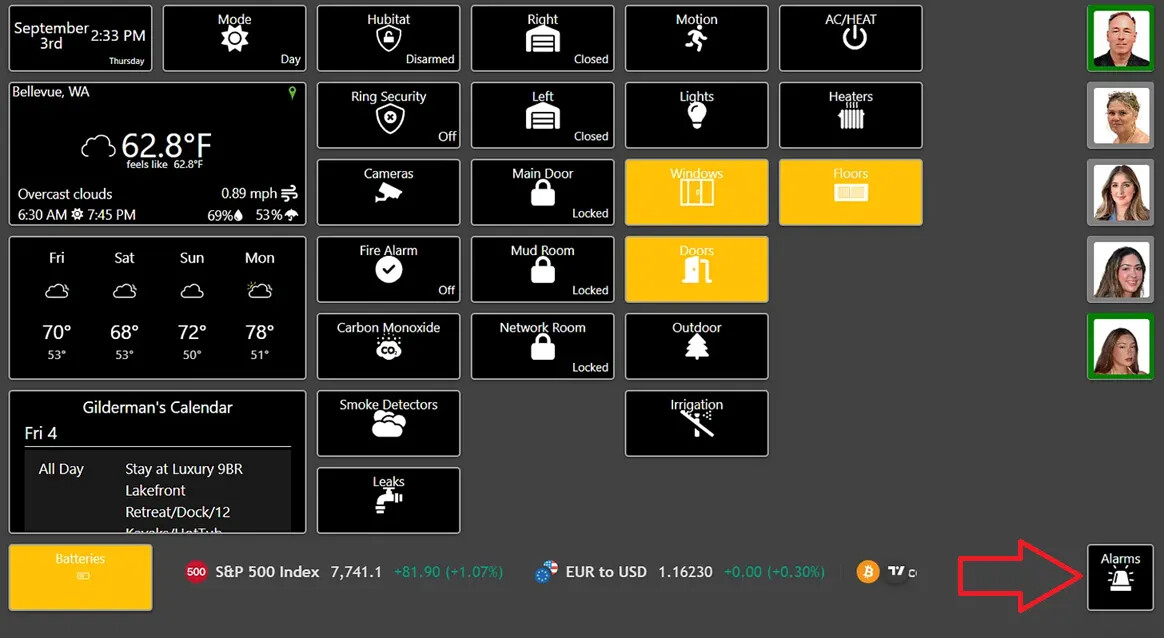
The Alarms tile in the bottom-right is where infrastructure/observability problems show up. So SharpTools remains the interface I actually use for the house, while Grafana watches the systems underneath it.
I like the separation: SharpTools answers “What is my house doing?”, while Grafana answers “Is the system behind my house healthy?” If Grafana finds something wrong, the result comes back into SharpTools where I’ll actually see it.
I wrote up the complete setup and the thinking behind it here: When Your Smart Home Puts You on Call 24×7 - Ilia Gilderman
I also open-sourced the Hubitat → Grafana heartbeat/health monitor and Grafana dashboard: GitHub - gilderman/HubitatGrafana: Simple Hubitat Grafana APP to monitor Hub health and up time via loki collector · GitHub
The next thing I’m working on is device-level observability—figuring out how to identify unhealthy Z-Wave/Zigbee devices without simply dumping every device event into Grafana.
I’d be interested to hear how other SharpTools users with larger installations are handling system/device health and alerting.