An astronomical monitoring tile displaying real-time moon phases, dynamic sun position tracking, and solar radiation metrics from local weather sensors - powered by OpenWeather API and SharpTools integration.
 Overview
Track celestial events and solar conditions at a glance. This tile combines astronomical calculations with real-time sensor data to provide comprehensive information about sun and moon positions, phases, and environmental solar metrics.
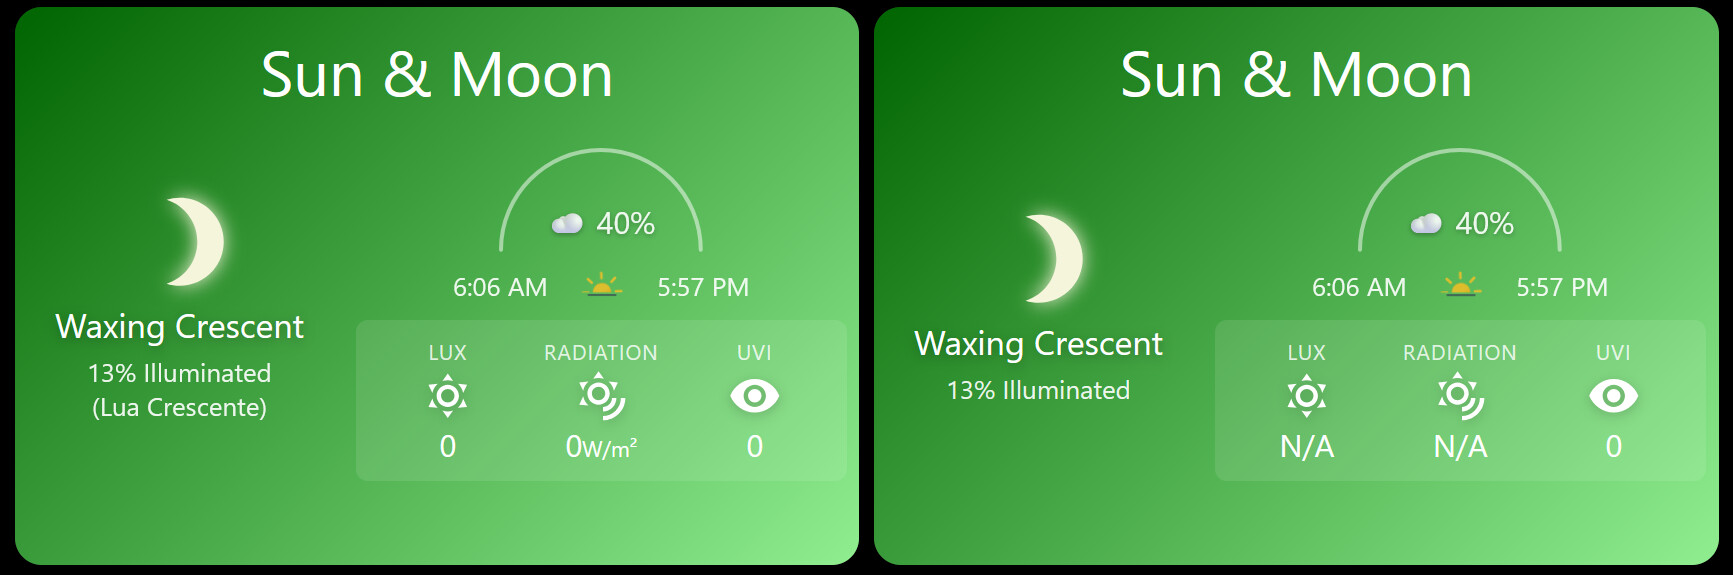
Left Panel: Current moon phase with visual SVG representation, phase name in English and Portuguese, and illumination percentage.
Right Panel: Dynamic sun position gauge showing the sun’s journey across the sky throughout the day, with sunrise/sunset times and animated horizon icon.
Bottom Panel: Real-time solar metrics from your weather station including ambient light (LUX), solar radiation (W/m²), and UV Index with color-coded safety levels.
Perfect for:
- Astronomy enthusiasts tracking moon phases
- Gardeners planning outdoor activities
- Photographers timing golden hour shots
- Solar panel monitoring
- UV safety awareness
 Key Features
Moon Phase Visualization
- Accurate lunar calculations using Julian Day algorithm
- 8 distinct moon phases with custom SVG icons:
- New Moon, Waxing Crescent, First Quarter, Waxing Gibbous
- Full Moon, Waning Gibbous, Last Quarter, Waning Crescent
- Bilingual labels - English and Portuguese phase names
- Illumination percentage - exact moon brightness
- Soft glow effect around moon icon
Sun Position Tracker
- Dynamic arc gauge showing sun’s path across the sky
- Animated sun icon moves along arc throughout the day
- Sunrise/sunset times with pulsing horizon icon
- Real-time positioning - icon placement updates every refresh
- Daylight-only display - sun icon only appears during daytime hours
Solar Metrics (from Local Sensors)
LUX (Ambient Light Level):
- Formatted with thousands separator (e.g., “1,229 lx”)
- Measures total visible light reaching surface
Solar Radiation:
- Displayed in W/m² (Watts per square meter)
- Direct measurement of solar energy intensity
- Compact unit display (reduced font size)
UV Index (UVI):
- Color-coded safety levels:
- White (0-2) - Low: Minimal sun protection needed
- Gold (3-5) - Moderate: Sun protection recommended
- Red (6-7) - High: Sun protection essential
- Black (8+) - Very High/Extreme: Maximum protection required
 Requirements
Required:
- SharpTools Premium subscription
- OpenWeather API key (get free key)
Optional (for Solar Metrics):
- Weather station with solar sensors (e.g., Ecowitt GW2000B)
- Home Assistant or similar integration platform
- SharpTools device mappings for:
- Solar LUX sensor (attribute:
illuminance) - Solar Radiation sensor (attribute:
state) - UV Index sensor (attribute:
state)
- Solar LUX sensor (attribute:
 Quick Import
Import SharpTools Tile: Sun and Moon Information v1.1
 Configuration
Step 1: Basic Setup
OpenWeather API Key (required):
- Get free key from OpenWeatherMap
- Used for sunrise/sunset times and location data
Location:
- Format:
latitude,longitude - Example:
8.9823,-79.5199(Panama City) - Find coordinates: LatLong.net
Step 2: Optional Solar Sensors
Map your weather station sensors (all optional):
Solar Lux Sensor:
- Device with
illuminanceattribute - Measures ambient light in lux
- Formatted display with thousands separator
Solar Radiation Sensor:
- Device reporting solar radiation
- Uses
stateattribute - Displayed in W/m²
UV Index Sensor:
- Device reporting UV index
- Uses
stateattribute - Auto color-codes based on value (0-11+)
Note: Tile works perfectly without sensors - moon/sun data comes from API. Sensors add bonus environmental metrics.
Step 3: Refresh Settings
Refresh Interval:
- Default: 30 minutes
- Minimum: 1 minute
- Controls how often moon/sun positions update
- Sensor data updates in real-time regardless of this setting
 Understanding the Display
Moon Phase Names
Waxing (Growing):
- New Moon (Lua Nova) - 0% illuminated
- Waxing Crescent (Lua Crescente) - 1-49% growing
- First Quarter (Quarto Crescente) - 50% right side lit
- Waxing Gibbous (Quase Cheia) - 51-99% growing
Waning (Shrinking):
- Full Moon (Lua Cheia) - 100% illuminated
- Waning Gibbous (Minguante Gibosa) - 99-51% shrinking
- Last Quarter (Quarto Minguante) - 50% left side lit
- Waning Crescent (Quase Nova) - 49-1% shrinking
Sun Position Arc
The sun icon travels along a semicircular arc representing the sun’s path from sunrise (left) to sunset (right). The icon position updates based on:
- Current time
- Sunrise time
- Sunset time
- Calculated percentage of daylight elapsed
The icon only appears during daylight hours (between sunrise and sunset).
UV Index Safety Guide
- 0-2 (White) - Low risk. Safe to be outside. Minimal protection needed.
- 3-5 (Gold) - Moderate risk. Seek shade during midday. Wear sunscreen.
- 6-7 (Red) - High risk. Reduce sun exposure 10am-4pm. Protection essential.
- 8+ (Black) - Very high/extreme. Minimize sun exposure. Maximum protection required.
 Display Optimization
Mobile Features:
- Abbreviated text to save space
- Optimized icon sizing
- Touch-friendly layout
Desktop Features:
- Full text labels
- Larger metrics display
- Enhanced visual spacing
For customization of colors, thresholds, or layout adjustments, I recommend using Claude.AI to help modify the CSS variables and calculation parameters.
 Technical Details
Moon Phase Algorithm
Uses Julian Day calculation to determine exact lunar phase and illumination percentage. Updates automatically based on current date/time and location.
Sun Position Calculation
Polar coordinate system maps sun’s position onto semicircular arc:
- 180° = sunrise (left)
- 90° = solar noon (top)
- 0° = sunset (right)
Sensor Integration
Real-time subscriptions to SharpTools devices via onValue callbacks. Validates numeric values and updates display immediately when sensors report new readings.
 Screenshots
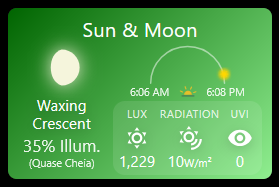
The screenshot shows the tile on mobile with:
- Left: Waxing Crescent moon at 35% illumination (Quase Cheia in Portuguese)
- Right: Sun arc with icon positioned mid-morning (around 9am), sunrise at 6:06 AM, sunset at 6:08 PM
- Bottom: Solar metrics showing 1,229 LUX, radiation reading, and UV index with appropriate color coding
 Resources
GitHub Repository: GitHub - wilsonmarcolin/sharptools-custom-tiles: SharpTools Custom Tiles by Wilson Marcolin & Claude AI
OpenWeather API:
Weather Station Integration:
Other Tiles in Collection:
- AC Control - Climate control
- Weather Information - Multi-layout weather
- UPS Information - Power monitoring
- SpeedTest Monitor - Network monitoring
 About the Developer
I’m not a professional developer - I’m an enthusiastic cyclist, and besides the rain forecast, knowing about topics such as radiation for those who are exposed to the sun all the time is important..
If you encounter any issues or have suggestions, feel free to share feedback! However, please understand that support may be limited as this is a personal project shared freely with the community.
Apologies in advance for any operational flaws!
 License & Disclaimer
MIT License - Free to use, modify, and distribute
USE AT YOUR OWN RISK - This tile displays astronomical calculations and sensor data. Moon phase accuracy depends on location settings. UV Index readings depend on sensor accuracy - always verify with official sources before making health decisions based on UV levels. The author is not responsible for sunburns, missed astronomical events, or decisions made based on displayed data.
See GitHub repository for complete license and documentation.
Version: 1.2 (October 2025)
Authors: Wilson Marcolin & Claude.AI
Tested with: SharpTools Custom Tiles v0.2.1+
Powered by: OpenWeather API
Tags: #custom-tile #astronomy #moon-phase #sun-tracking #solar-metrics #uv-index #weather-station #gw2000b #lux #solar-radiation