A grade network monitoring tile that displays ** up to 3 simultaneous speed test locations** with synchronized historical charts and real-time status indicators - powered by Ookla Speedtest CLI data.
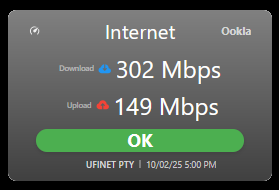
 Mini Version
Overview
SpeedTest Monitor v2.3 brings enterprise-grade visualization to your SharpTools dashboard by integrating seamlessly with Ookla’s Speedtest CLI.
Monitor multiple locations simultaneously — your home and SpeedTest servers in different places running automated tests. Each location displays current speeds, historical trends for 24 hours, and the last test status.
Perfect for:
- Remote workers tracking home office connectivity
- Documenting performance issues for support tickets
- Comparing speeds across different locations or ISPs
 Key Features
- Triple Location Monitoring - Track up to 3 independent test locations simultaneously
- Multi-Hour Historical Charts - View performance trends with synchronized timeline
- Synchronized Y-Axis - All charts share the same scale for easy comparison
- Color-Coded Metrics:
- Download speeds in blue
- Upload speeds in red
- OK/NO OK status badges
- Real-Time Updates - Instant display when new tests complete
- Comprehensive Data Display:
- Current download/upload speeds
- Ping latency
- Test server name
- Test timestamp
- Historical trend lines with data points
 Requirements
Required:
- SharpTools Premium subscription
- Ookla Speedtest CLI (free or paid version). In the GitHub directory, I have provided a brief tutorial to help install the SpeedTest client and VPN management, which can be used for testing in different locations if necessary.
- Automation platform to run tests and store results (Node-RED, Home Assistant, etc.)
- SharpTools Variables (String type) to store test results
Data Source Setup: You need to set up an automation that:
- Runs Speedtest CLI periodically
- Parses the JSON output
- Stores formatted data in SharpTools Variables
Variable Format Required: Each variable must contain comma-separated values in this order:
validity,download,upload,ping,server,timestamp,YYMMDDDD,download,upload,[repeat...]
Example:
true,450.5,35.2,12.5,Speedtest.net,1735689600000,25010114,425.1,32.5,25010115,430.2,33.1
Date Format: YYMMDDDD (Year-Month-Day-Hour)
- YY: 2-digit year (25 = 2025)
- MM: Month (01-12)
- DD: Day (01-31)
- HH: Hour (00-23)
 Quick Import
Import SharpTools Tile: SpeedTest Monitor v2.3
Mini Version Download
Import SharpTools Tile: SpeedTest Monitor v1.1 (Mini)
 Configuration
Step 1: Create SharpTools Variables
Create 1, 2 or 3 String variables in SharpTools to store speed test results:
speedtest_location1(e.g., Home Office)speedtest_location2(e.g., Remote Office)speedtest_location3(e.g., Vacation Home)
Step 2: Configure the Tile
After importing and adding to your dashboard:
Speed Test Variables:
- Variable 1 - Select your first location’s variable
- Variable 2 - (Optional) Select second location
- Variable 3 - (Optional) Select third location
Display Options:
- Use Gradient Background - Enable horizontal gradient (default: on)
- Reserve space for tile label - Enable if using tile titles in dashboard
Step 3: Set Up Automation
You’ll need to create an automation that:
- Runs Speedtest CLI periodically (recommended: every hour)
- Parses the output to extract:
- Test validity status
- Download/upload speeds
- Ping latency
- Server name
- Timestamp
- Maintains historical data (last 24 test results)
- Updates SharpTools Variable with formatted string
Sample Node-RED flow and parsing scripts available in the GitHub repository documentation.
 Understanding the Display
Status Badge:
- Green “OK” - Test completed successfully
- Red “NO OK” - Test failed or incomplete
Speed Values:
- Blue download icon + speed in Mbps
- Red upload icon + speed in Mbps
- Ping latency in ms
- Server name/location
Historical Charts:
- Blue line = Download speeds over time
- Red line = Upload speeds over time
- X-axis shows hours (labeled every 3 hours)
- Y-axis shows speed in Mbps (synchronized across all charts)
- Dots mark individual test results
Chart Synchronization: All charts share the same Y-axis scale, making it easy to compare performance across locations at a glance.
 Why This Tile Was Created
The Problem: ISPs often throttle speeds or have intermittent issues, but proving it requires historical data. Running manual speed tests doesn’t capture the full picture, and dedicated monitoring solutions are expensive.
The Solution: Automate speed tests with Ookla CLI and visualize the results in your existing SharpTools dashboard. Track multiple locations, identify patterns, and have concrete data when contacting support.
The Result: Clear visibility into network performance trends. I’ve used this data to successfully dispute throttling issues with my ISP and optimize my network configuration based on actual performance patterns.
 Display Optimization
This tile has been specifically optimized for iOS screens.
For customization of colors, chart scaling, or layout adjustments, I recommend using Claude.AI to help modify the CSS variables and chart parameters.
 Advanced Features
Global Time Synchronization: All charts use the earliest test date as the zero point, ensuring perfect alignment when comparing locations.
 Screenshots
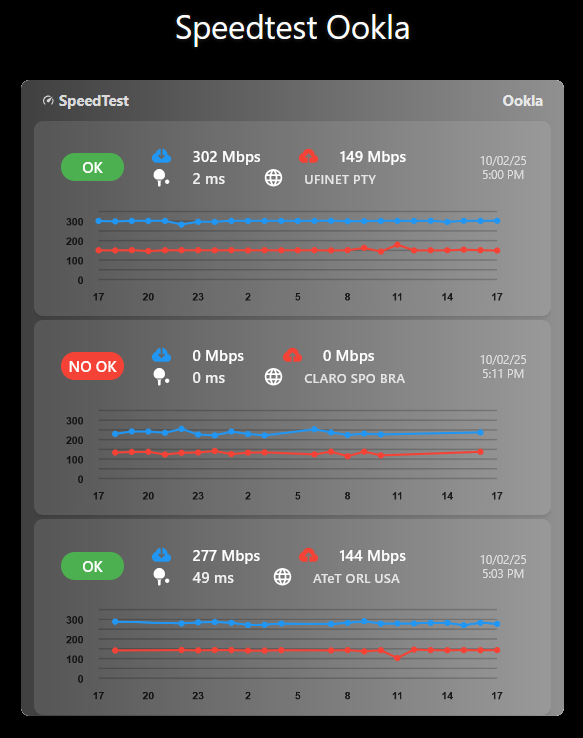
The screenshot shows three speed test locations being monitored simultaneously:
- Top: Home connection - OK status, 302/149 Mbps
- Middle: Remote location - NO OK status (test failed)
- Bottom: Another location - OK status, 277/144 Mbps
Note how all three charts share the same Y-axis scale (0-300 Mbps), making performance comparison immediate and obvious.
 Resources
GitHub Repository: GitHub - wilsonmarcolin/sharptools-custom-tiles: SharpTools Custom Tiles by Wilson Marcolin & Claude AI
Speedtest CLI:
Integration Examples:
- Node-RED flow (see GitHub repo)
- Home Assistant automation
- Python parsing script
Other Tiles in Collection:
- AC Control - Climate control
- HT Sensor - Environmental monitoring
- Humidity Comparison - Smart ventilation
- Weather Information - Multi-source weather
 About the Developer
I’m not a professional developer - I’m a remote worker who needed reliable network monitoring across multiple locations.
If you encounter any issues or have suggestions, feel free to share feedback! However, please understand that support may be limited as this is a personal project shared freely with the community.
Apologies in advance for any operational flaws!
 License & Disclaimer
MIT License - Free to use, modify, and distribute
USE AT YOUR OWN RISK - This tile displays data provided by your automation setup. The accuracy of speed test results depends on your Speedtest CLI configuration, network conditions, and automation implementation. The author is not responsible for incorrect readings or automation failures.
See GitHub repository for complete license, disclaimer, and setup examples.
Version: 2.3 (October 2025)
Authors: Wilson Marcolin & Claude.AI
Tested with: SharpTools Custom Tiles v0.2.1+
Powered by: Ookla Speedtest CLI
Tags: #custom-tile #speedtest #network-monitoring #ookla #performance #bandwidth #isp #multi-location