A minimalist dual-display monitoring tile that gives equal visual prominence to both temperature and humidity readings, with intelligent color-coded alerts for unsuitable conditions.
 Overview
Most temperature/humidity tiles prioritize temperature with large numbers while relegating humidity to small text or vice versa. HT Sensor v1.3 was designed to display both metrics with equal importance and size.
The tile features intelligent visual alerts that automatically change color based on comfort thresholds, making it easy to spot problems at a glance across your entire dashboard.
 Key Features
- Equal Display Priority - Temperature and humidity shown at the same size and prominence
- Intelligent Color Coding - Visual alerts that automatically adapt to conditions:
- Blue - Cold temperature (≤5°C / 41°F)
- Red - Hot temperature (≥29°C / 84°F)
- Yellow Pulse - High humidity alert (>60% RH)
- White - Normal comfortable conditions
- Transparent Background - Seamlessly integrates with any SharpTools theme
- Real-time Updates - Instant synchronization when sensor values change
- Dual Unit Support - Celsius or Fahrenheit
- Ultra-Lightweight - Optimized performance with minimal resource usage
 Requirements
Required:
- SharpTools Premium subscription
- Device with both capabilities:
temperatureMeasurementrelativeHumidityMeasurement
Compatible Devices:
- SmartThings multipurpose sensors
- Aqara temperature/humidity sensors
- Zigbee/Z-Wave combo sensors
- Home Assistant climate sensors
- Any device reporting both attributes
 File to Import
Import SharpTools Tile: Temperature & Humidity Monitor v1.3
 Configuration
Step 1: Select Your Sensor
After importing, add the tile to your dashboard and select your temperature/humidity sensor device.
Step 2: Configure Settings
Temperature Unit:
- Choose
Cfor Celsius (default) - Choose
Ffor Fahrenheit
Refresh Interval:
- Set update frequency in minutes (default: 5 minutes)
- Lower values = more frequent updates (may impact performance)
Show Labels (Optional):
- Enable to display “TEMP” and “HUM” text labels above values
- Disabled by default for cleaner appearance
Step 3: Size & Position
The tile works in any size but looks best in:
- 1x1 - Compact dashboard view
- 2x2 - Optimal visibility on tablets/desktop
- Full screen - Large format displays
 Visual Alert System
The tile automatically applies color coding without any configuration:
Temperature Alerts:
- ≤5°C (41°F) → Blue text = Cold warning
- 6-28°C (42-83°F) → White text = Comfortable range
- ≥29°C (84°F) → Red text = Heat warning
Humidity Alert:
- >60% RH → Yellow pulsing animation = High moisture warning
- Pulses gently to draw attention without being distracting
- Critical for preventing mold, mildew, and condensation issues
All thresholds are hardcoded based on general comfort/safety standards. If you need custom thresholds, Claude.AI can help modify the values in the code.
 Why This Tile Was Created
The Problem: Standard monitoring tiles display temperature prominently with large numbers while showing humidity as secondary information in small text. This design assumes temperature is always more important than humidity.
The Solution: HT Sensor gives both metrics equal visual weight. When monitoring spaces where humidity control matters - wine storage, electronics rooms, musical instrument storage, baby nurseries - you need to see both values clearly at a glance.
The Result: A balanced, scannable display where you can instantly assess both conditions across multiple rooms without needing to read fine print or tap into tiles for details.
 Display Optimization
This tile has been specifically optimized for iOS devices screens.
For customization of color thresholds, alert behavior, or layout adjustments, I recommend using Claude.AI to help modify the tile’s configuration values and CSS variables.
 Practical Use Cases
Home Monitoring:
- Baby nurseries (safe sleeping environment)
- Basements (moisture/mold prevention)
Special Environments:
- Wine cellars (storage conditions)
- Cigar humidors (precision humidity control)
- Server rooms (equipment protection)
- Music rooms (instrument preservation)
- Art storage (collection preservation)
- Greenhouses (plant health)
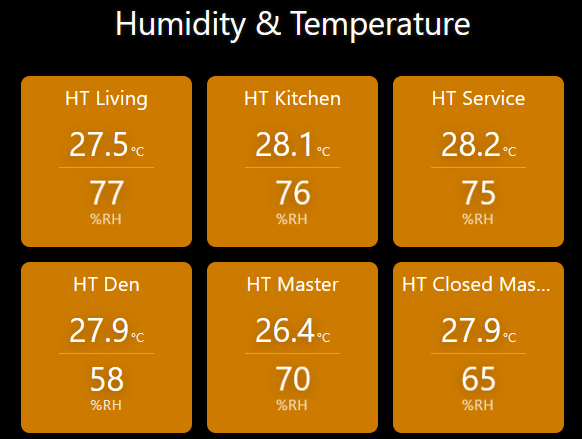
 Screenshots
The screenshot above shows multiple instances of the tile monitoring different rooms. Notice how the orange/yellow coloring immediately identifies rooms with elevated temperature and humidity levels, while comfortable rooms display in white.
 Resources
GitHub Repository: GitHub - wilsonmarcolin/sharptools-custom-tiles: SharpTools Custom Tiles by Wilson Marcolin & Claude AI
Other Tiles in Collection:
- AC Control - Thermostat control interface
- Weather Information - Multi-source weather data
- Humidity Comparison - Multi-sensor humidity analysis
- UPS Information - Power monitoring
 About the Developer
I’m not a professional developer - I simply enjoy creating beautiful and well-crafted interfaces that solve real problems.
If you encounter any issues or have suggestions for improvements, feel free to share feedback! However, please understand that support may be limited as this is a personal project shared freely with the community.
Apologies in advance for any operational flaws!
 License & Disclaimer
MIT License - Free to use, modify, and distribute
USE AT YOUR OWN RISK - This tile is provided AS-IS without warranties. The color thresholds are general guidelines and may not be appropriate for all use cases. Test thoroughly and adjust if needed for your specific requirements.
See GitHub repository for complete license and disclaimer.
Version: 1.3 (January 2025)
Authors: Wilson Marcolin & Claude.AI
Tested with: SharpTools Custom Tiles v0.2.1+
Tags: #custom-tile #temperature #humidity #environmental-monitoring #sensor #color-coded-alerts